Builder
Audience
Audience: Administrators & Read/Write Users
Overview
Builder allows users to take a snapshot of any subset of a Master Chart. Snapshots created using Builder are loaded into Workbench as Chart Documents.
Administrators and Read/Write users can modify Chart Documents as needed. Chart Documents can be saved, opened, closed, exported, and even synchronized with source data.
Accessing Builder
Click on the Builder icon in the Top Toolbar while in Viewer.
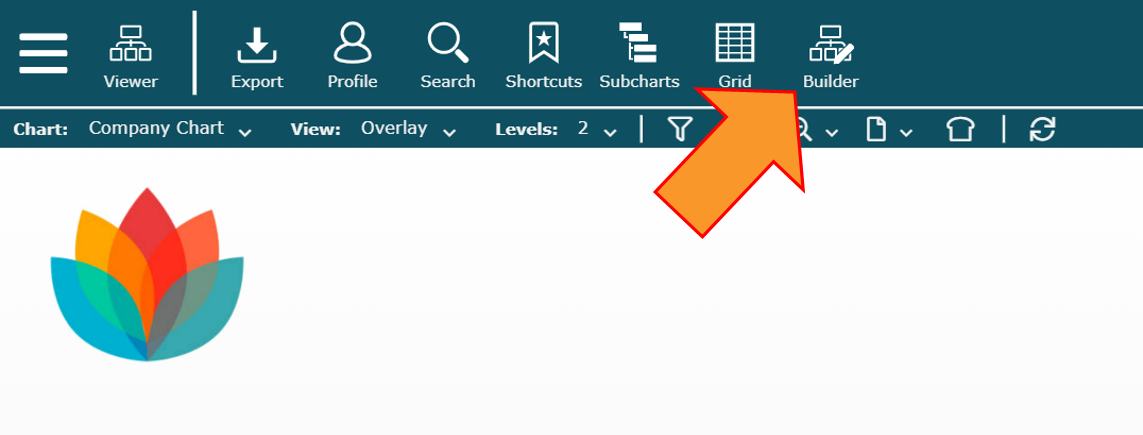
The Builder menu is displayed.
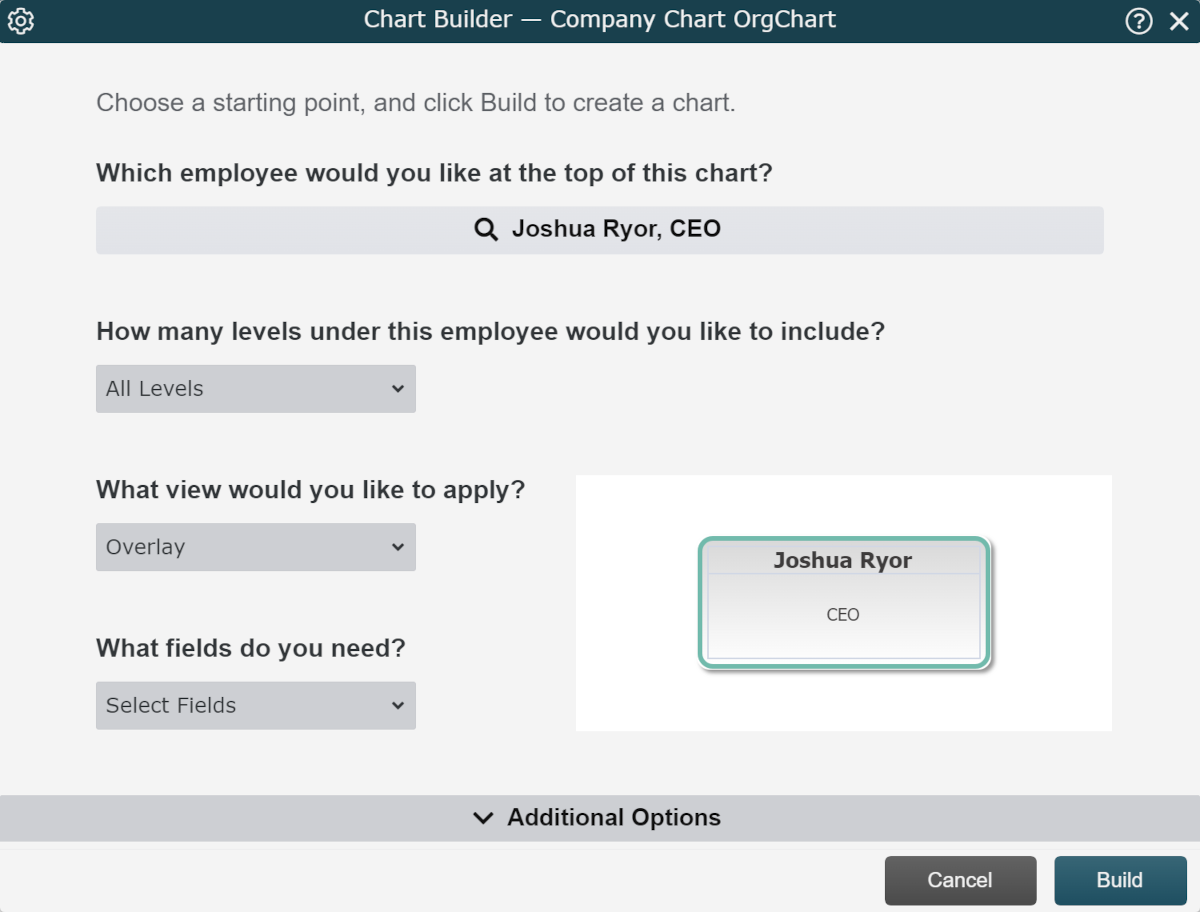
Building a Chart
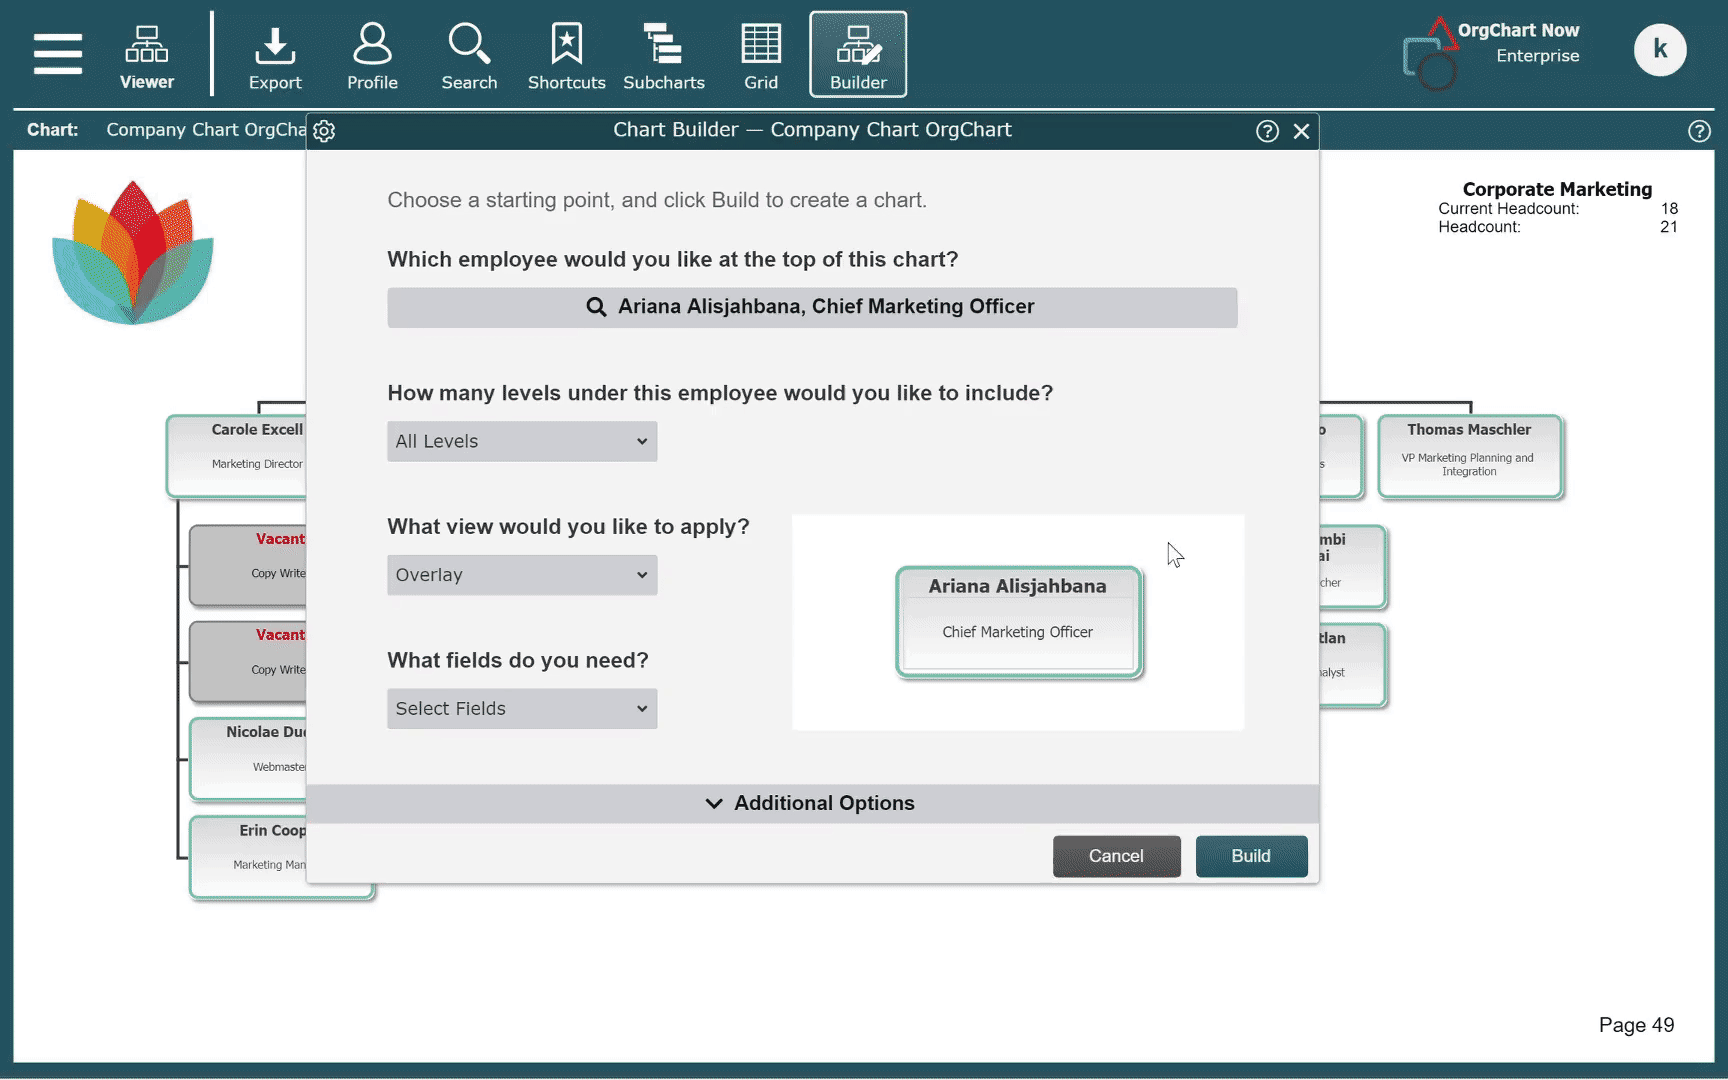
Click on the search bar (beneath the Which employee would you like at the top of this chart prompt) to search for the employee who will be at the top of the Chart Document.
Click on the Levels dropdown menu (under the How many levels under this employee would you like to include prompt) to select the number of organizational levels beneath the top employee to include in the Chart Document.
Click on the Views dropdown menu (under the What view would you like to apply prompt) to select the View to apply to the Chart Document.
Note
Administrators can click on the
 icon in the top left of the Builder menu, in order to access the Chart Settings: Chart Builder panel. Here, admins can modify which Views are available in this View dropdown.
Optionally, click on the Fields dropdown menu, and then add or remove which fields should be displayed in the primary Box Style applied in this View. The Box Style preview (displayed to the right) adjusts accordingly.
Note
This is helpful for making ad-hoc changes without having to create a new View.
Only fields that are present in the Profile are available to be added to or removed from the primary Box Style.
Optionally, click on the Additional Options button to review other configuration options.
Click on Build. The Chart Document is generated in Workbench.
Additional Options
Click on the Additional Options button to reveal more settings that you can configure for your Chart Document.
Use the tabs in the left hand menu to review all of your options.
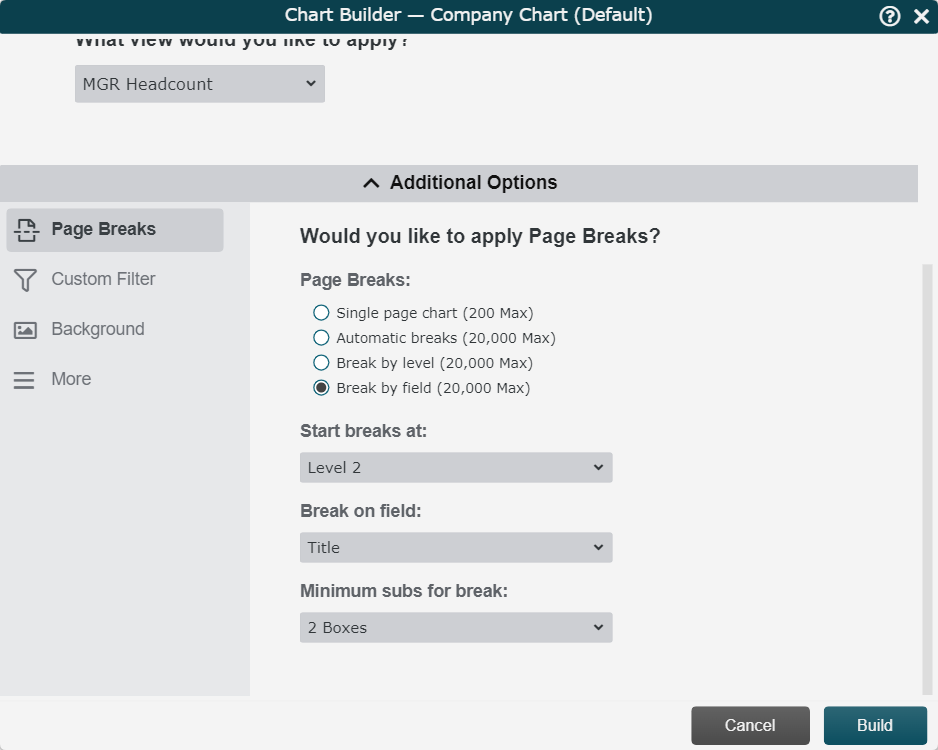
Page Breaks
Set the pagination rules for the Chart Document.
Single Page Chart | Create a Chart Document that is a single page. NoteThe max number of boxes allowed on a single page chart can be adjusted in the Chart Settings: Chart Builder panel. |
Automatic Breaks | Let OrgChart determine the optimal page breaking for your chart. You can choose to set the page density (Standard, Dense, or Very Dense), which will determine how many boxes should be on each page before inserting a page break. |
Break by Level | Insert a page break every 2, 3, 4, or 5 levels. You can select a minimum amount of subordinates needed before a break is inserted. |
Break by Field | Insert a page break every time a value for the selected field differs from the top record of the previous page. You can select a minimum amount of subordinates needed before a break is inserted. |
Start Breaks At | Select the level at which page breaks will begin to be inserted. |
Custom Filter
Specify a data filter for the Chart Document, and define the filter behavior.
Specify Data Filter | Check to begin defining a filter with the Field, Comparison, and Value dropdown menus, or using custom logic. Records matching the filter criteria will be displayed in the generated Chart Document. |
Boxes matching custom logic (advanced) | Enter a filter using a java-script format. |
Include Filtered Managers | Check to include managers who have subordinates that match the defined filter criteria, even if those managers do not match the filter criteria themselves. |
Chain of Command | Check to Include the Chain of Command leading to the record(s) matching the filter criteria. |
Matches Only | Only records matching the filter criteria are displayed. on the Chart Document |
Include Direct Subordinates | Records that meet the filter criteria and their direct reports are displayed on the Chart Document. |
Include All Subordinates | Records that meet the filter criteria and all of their subordinates are displayed on the Chart Document. |
Background
Background dropdown | Select a background to apply to the Chart Document. NoteAdministrators can modify the list of available backgrounds to apply in the Chart Settings: Chart Builder panel. |
More
Include Orphans checkbox | Check to include all records that have a missing or invalid supervisor. Orphan records can be accessed in the Staging panel. |
Chain of Command checkbox | Include the reporting line above the top position of the Chart Document. Reference the Chain of Command section in the Levels article for more information. |
Functional Chart | Display system-generated boxes that describe the functions of an organization. Reference the Functional Chart article for more information. |
Create Co-Head Chart | Create a Chart Document with two, lined top boxes. Reference the Co-Head Chart article for more information. |
Create Multi-Chart Document | Create multiple, independent charts within a single Chart Document (like tabs in an Excel spreadsheet). Reference the Multi-Chart Documents article for more information. |
Sorting
Sorting options are found in the More tab. Sorting determines the order in which boxes are placed under managers.
New Sort button | Click to add a new sort key. Select a field from the dropdown menu by which to sort boxes. |
 | Click the Sort Order icon to toggle ascending/descending sort order. |
 | Change sort key. |
 | Delete sort key. |
 | Move sort key down. |
 | Move sort key up. |