Rollup Examples
Audience
Audience: Administrators
Overview
Administrators can create rollup formulas to perform calculations based on specific fields from the data source. Static Rollup Formulas include:
Split | A SPLIT formula breaks a data string like comma delimited lists into substrings. |
Average | Calculates the average a field (for example, average age). |
Count | Counts a number of records that fit a given condition. |
Sum | Total of all values in a specific field. |
Min | The minimum value of a specific field. |
Max | The maximum value of a specific field. |
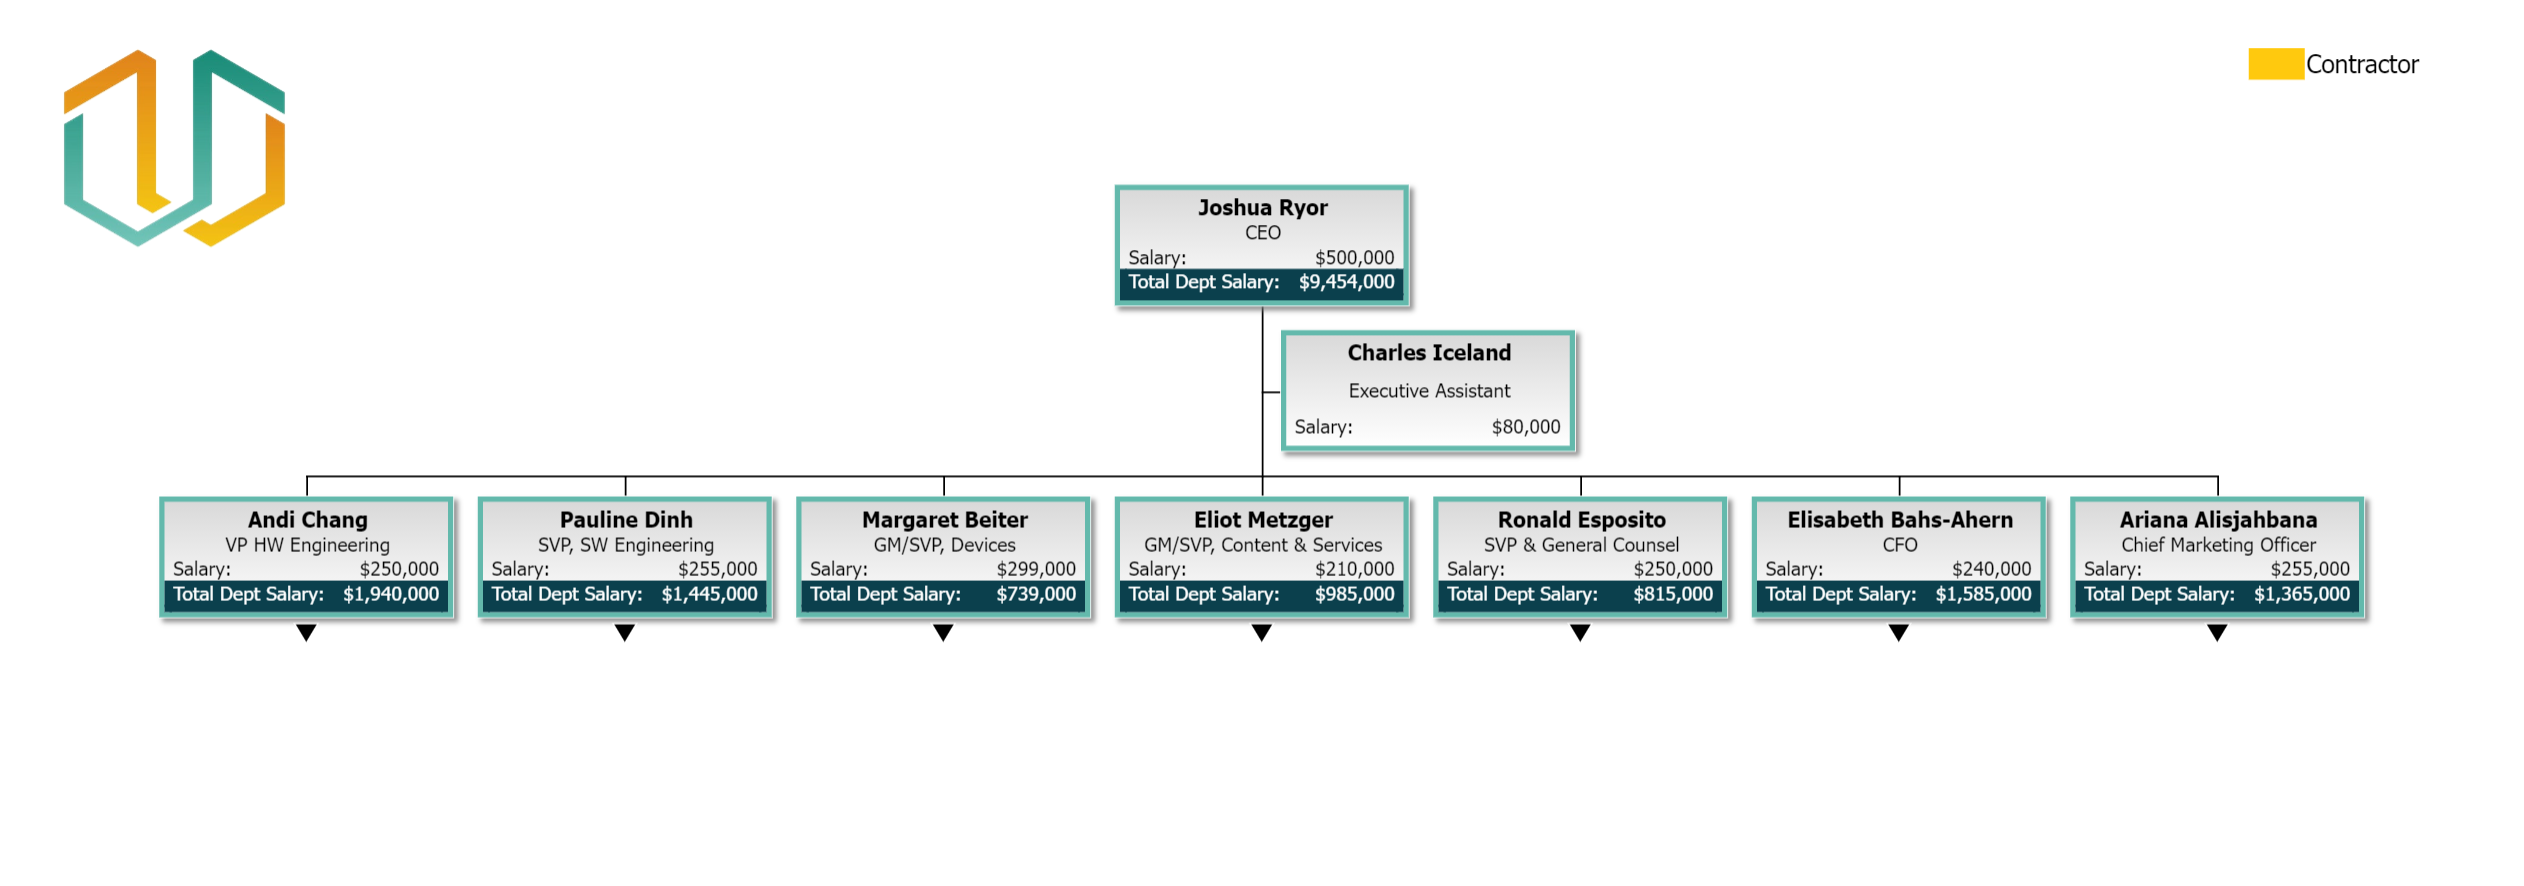
For this example, we will build a static rollup formula to sum all the salaries of all employees..
Creating a Sum Formula
Log in to OrgChart.
Click on the Mode Switcher icon in the Top Toolbar, and then select the Setup option. The Setup panel is displayed.

Click on the Chart Settings tile, and then select the Fields & Formulas option from the left side menu.
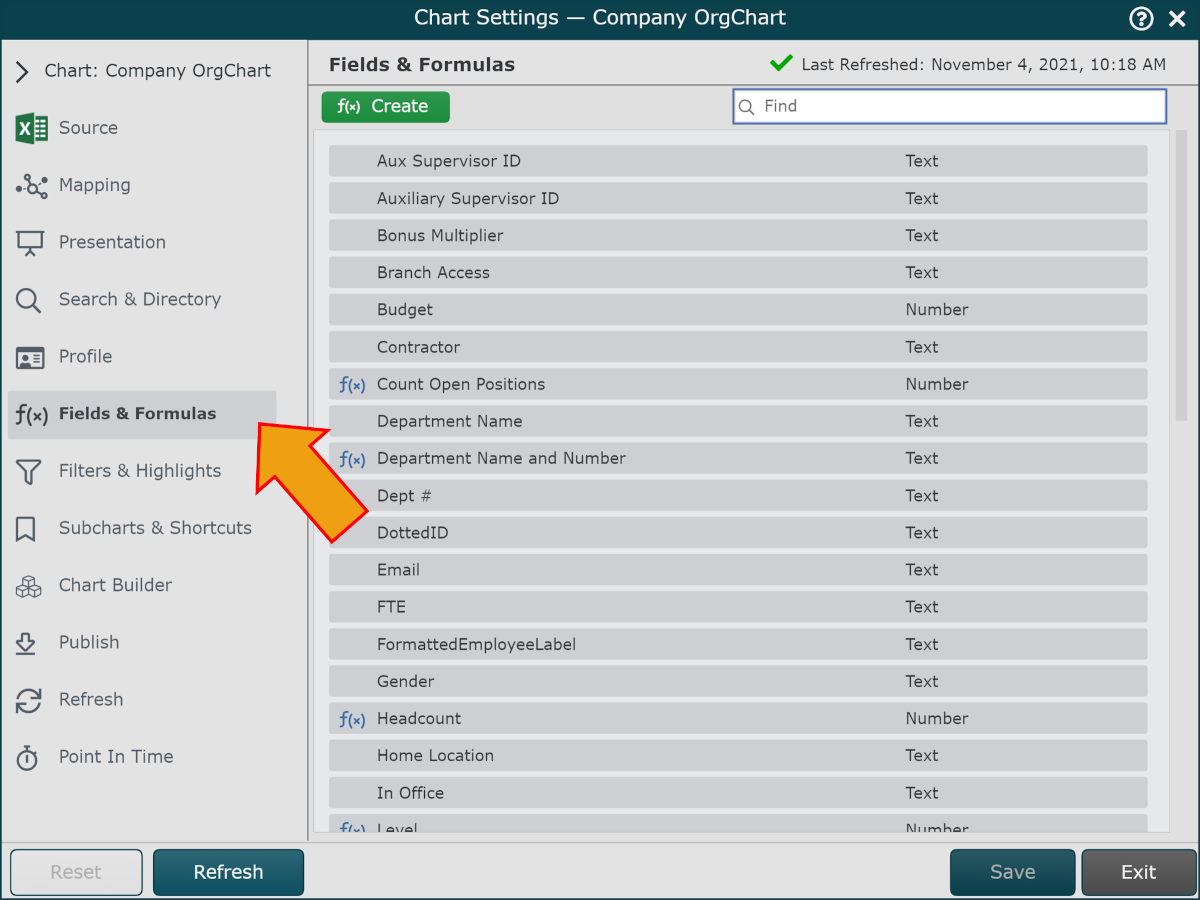
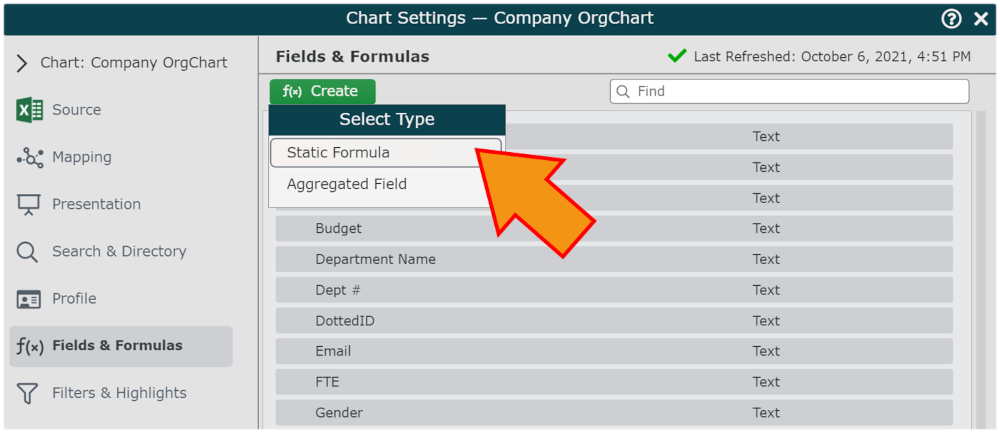
Click on the green f(x) Create button in the top left corner, and then select the Static Formula option. The Formula Editor panel is displayed.
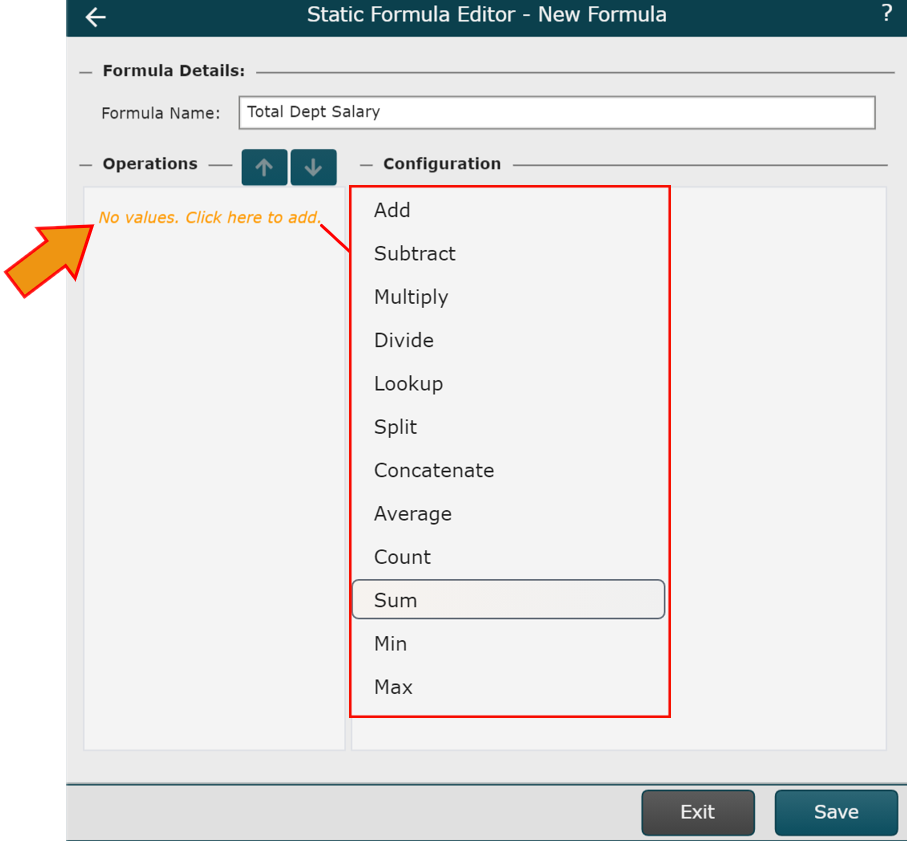
Click on the No values. Click here to add." hyperlink, and then select the Sum option from the dropdown menu.
Click on the Scope dropdown menu, and then select All Levels.
Check the Include Self checkbox.
Click on the Field dropdown menu, and then select the field that you want to sum (i.e Salary).
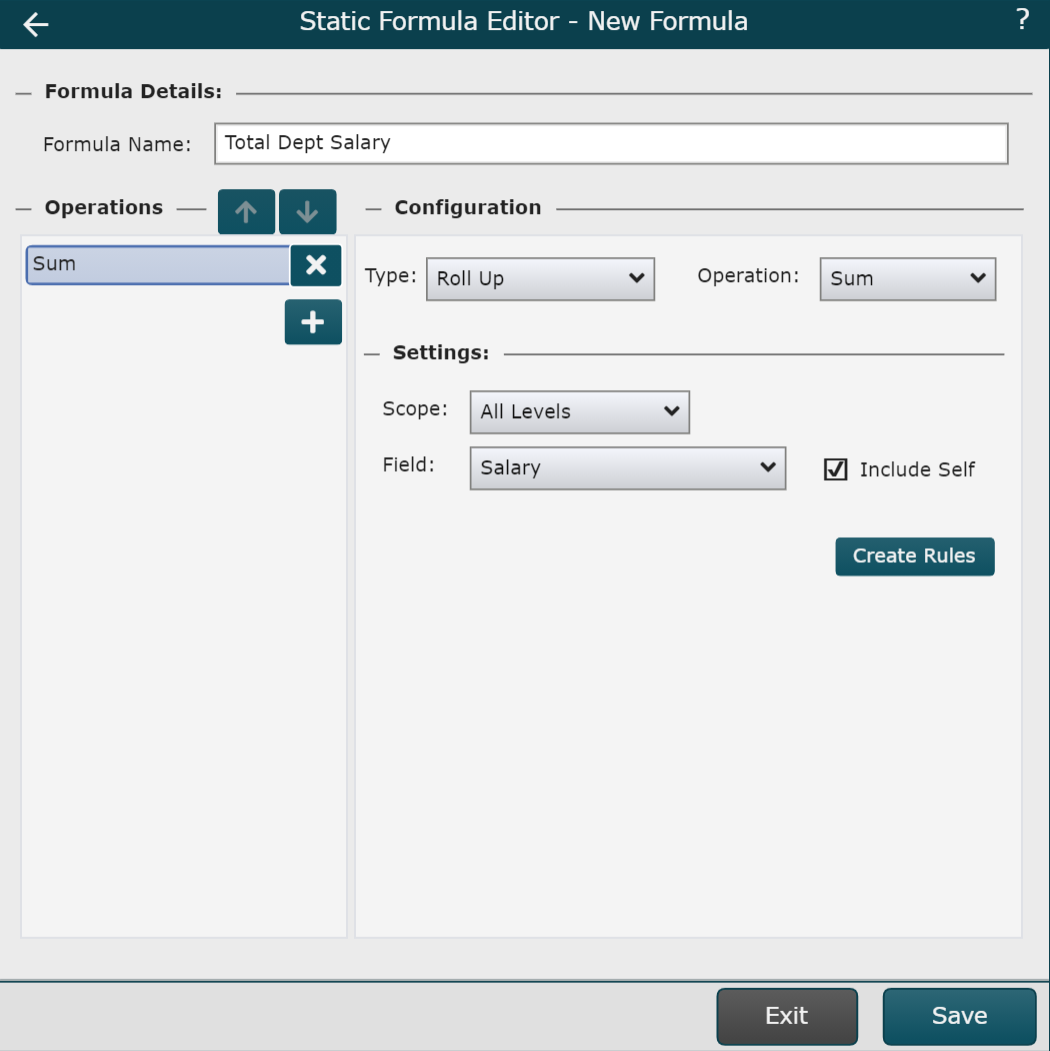
Click Save. The formula is added to the Fields and Formulas panel.
Mouse over a formula, and then click on the
 icon. The formula display options are displayed.
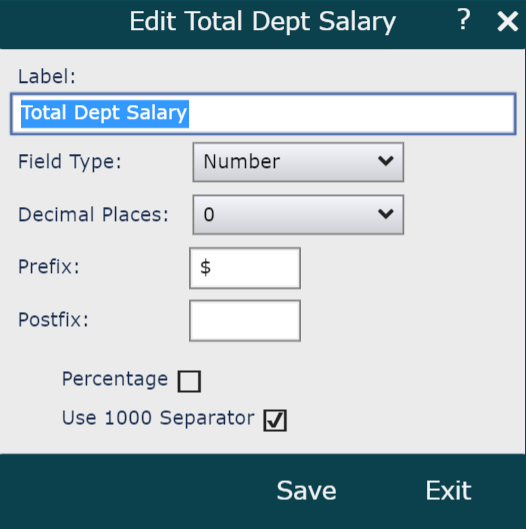
Click on the Field Type dropdown, and then select the Number option. This will ensure that the formula results display as a number.
Optionally, add a prefix, include an 1000 separator, and define the amount of decimals you would like displayed in the outcome.
Click Save and Refresh. When this formula is placed in a Box Style, the scope of the formula will determine what records beneath a record with the applied Box Style are included in the rollup.