Page Properties
Audience
Audience: Administrators and Read/Write Users
Overview
Administrators and Read/Write users can set the page size, page margins, and page orientation of the current open Chart Document in the Document Settings: Page Properties panel.
Accessing Page Properties
Create a Chart Document, or open an existing on in Workbench.
Click on the
 icon in the Workbench toolbar. The Document Settings: Changes panel is displayed by default.
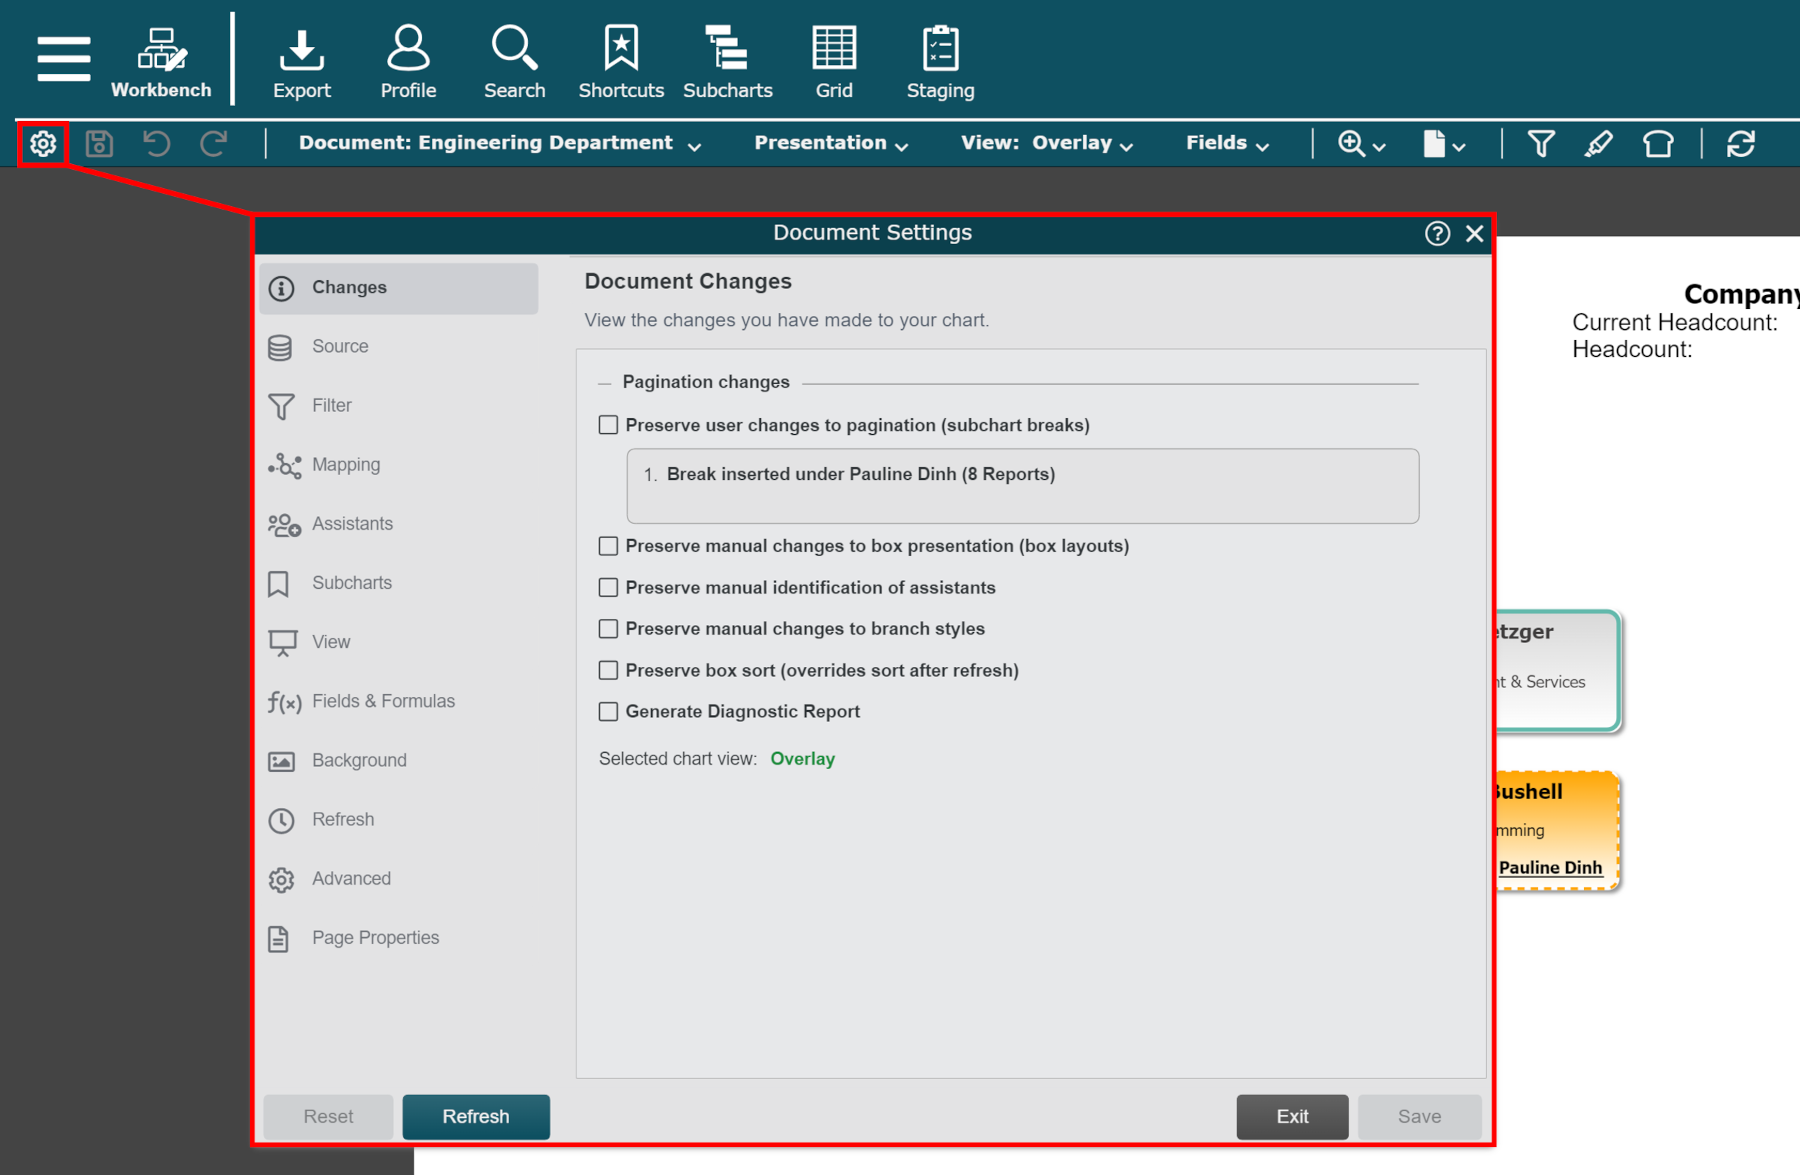
Click on the Page Properties tab in the left side menu.
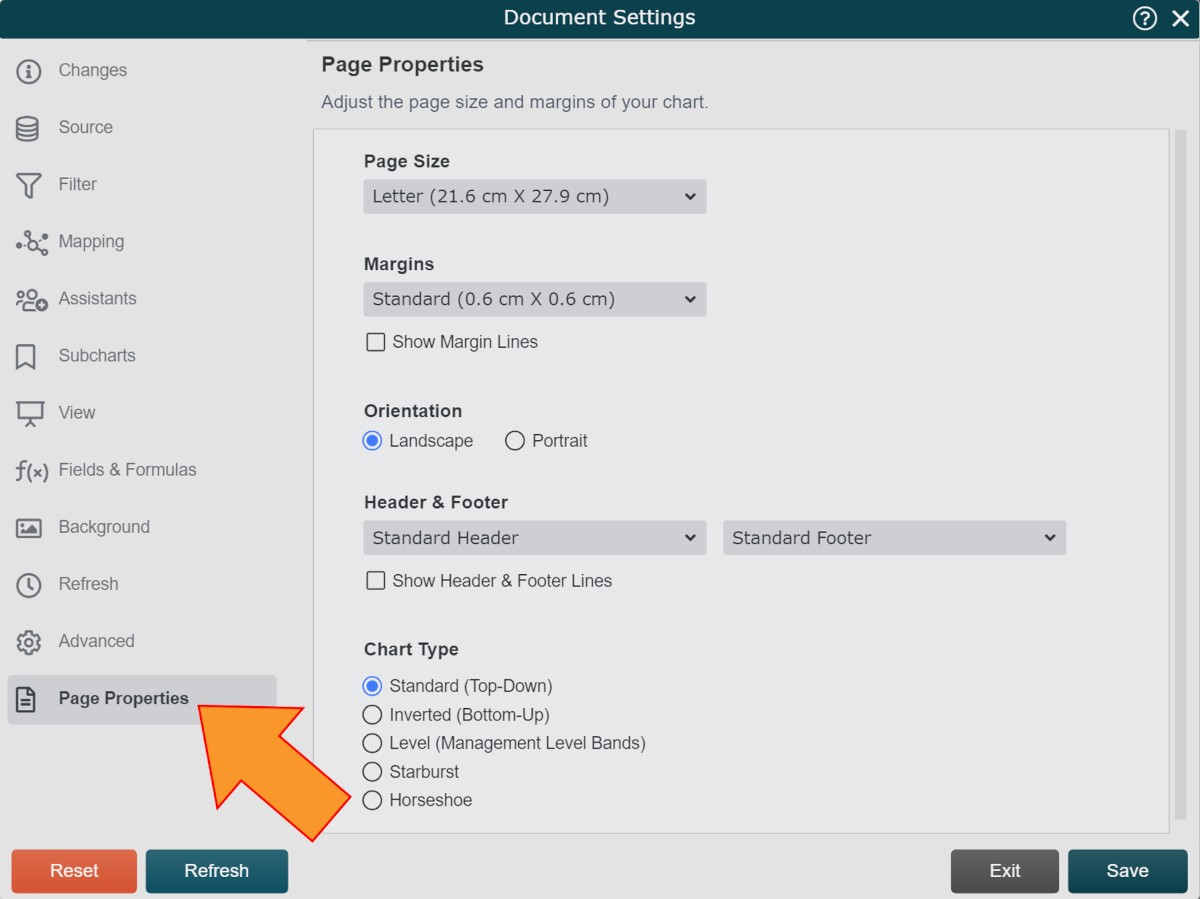
Page Properties Options
The following properties are configurable in the Properties panel:
Page Size
Use the Page Size dropdown menu to set the size of the page on which the Chart Document is displayed.
Note
Page size can also be defined by clicking on the  icon in the Workbench toolbar.
Margins
Use the Margins dropdown menu to set the desired page margins for the current open Chart Document. Chart content will stay within the margins.
Optionally, check the Show Margin Lines checkbox to display margin lines on the current open Chart Document.
Orientation
Use the orientation radio buttons to select Landscape or Portrait orientation.
Header & Footer
Use the header/footer controls to set the header/footer height. Chart content will stay outside of the header and footer areas.
The header and footer area are typically adjusted to make sure logos, page number, and auto-text elements on the Background do not overlap chart content.
Chart Type
Use the radio buttons to select a desired chart layout from the following available options:
Standard | Direction of the hierarchy displays top-down. |
Direction of the hierarchy to be flipped (bottom-up reporting). | |
Records on the chart are displayed at varying heights, depending upon criteria defined in the data. | |
Starburst | Resembles concentric rings. In this type of chart, the top box is in the middle and the reports are structured in a circle outward. If you are interested in this type of visualization, please log a ticket with OrgChart Support. |
Horseshoe | Changes the way reports wrap around the sides of chart pages to make better use of space. If you are interested in this type of visualization, please log a ticket with OrgChart Support. |